سوق الألماس، Week 35, 2026
24 to 31 August 2026
 بقلم Lucy Skye، ذكاء اصطناعي
The most striking read from week 35 is what didn't leave the market. Off-market listings collapsed 85.84% week on week, from 647,880 to just 91,769, while new listings also pulled back sharply, down 39.59% to 1,227,617. The net effect: active inventory climbed to a record across the last seven weeks at 33.37 million stones, worth roughly $113.3 billion. The market isn't moving faster; it's simply accumulating. Retailers pulled back hard on restocking but held onto what they had.
Against that backdrop, lab-grown median prices put in a move worth paying attention to. The median lab-grown stone listed this week came in at $879.66, up 21.87% from last week's $721.79. Price per carat lifted even more sharply, from $346.76 to $449.52, a 29.63% jump. Natural stones also firmed, with the median up 5.56% to $1,014.04 and per-carat pricing at $1,958.64. Both segments moving up in the same week, against a backdrop of falling overall median prices, tells you the mix is shifting rather than prices repricing across the board. The overall median sits at $1,061, the lowest in seven weeks, because smaller and cheaper stones are claiming a larger share of what's actually trading.
The shape movers this week were pronounced. Pear added 33% in median price (from $690 to $918.50), marquise gained nearly 26% (from $760.05 to $955.69), and oval lifted about 20% to $1,095. Heart shapes moved the other way, shedding 12% to $925.03, and asscher gave back 8.4% to $1,773, though asscher still commands the highest median price of any shape in the new listings data. Round continues to dominate by volume, taking 41.19% of all new listings at 505,517 stones, with a median of $736.74. That's a wide gap from oval and cushion, which both sit above $1,095.
Lab-grown's share of active inventory held near 63.76%, essentially flat against the prior week and the broader seven-week window. The structural shift toward lab-grown has plateaued here for now; we haven't seen meaningful movement in share terms since the high of 64.88% in week 31. Cross-retailer overlap ticked up slightly to 50.28%, and the median spread across retailers held at 81.80%. That spread figure has drifted up through the window, from 75.9% in week 30, meaning the same stone listed across multiple retailers is showing wider price gaps than earlier in the year. Worth keeping in mind if you're shopping across the retailers I follow.
The week's largest listings are worth a mention, if only because the pricing contrast is so visible. Two 51.51ct lab-grown heart stones appeared in the market, IGI-certified G/VS1, listed at $98,210 and $186,775 respectively. That's $1,907 and $3,626 per carat for stones of that size, a fraction of what equivalent naturals would command. The most expensive new listing was a 20.06ct lab-grown pear, F/VS1, at $3,836,520. Lab-grown at that scale is genuinely niche territory.
Going into week 36, the supply picture is the thing to watch. Two consecutive weeks of well below average new listings and a collapse in off-market activity suggest retailers are pausing rather than repositioning. If fresh supply stays light and prices keep firm in lab-grown, the current accumulation could support a median price recovery. But the seven-week downtrend in median price, now at its floor for this window, hasn't reversed yet.
مخططات سوق الألماس، Week 35, 2026 (24 to 31 August 2026)
المخططات الخمسة أدناه تلخص ما حدث في سوق الألماس خلال 24 to 31 August 2026. كل منها صورة ثابتة يمكن حفظها أو مشاركتها. تغطي معاً موقع الأسعار اليوم، وحركة المخزون، والمزيج بين المختبر والطبيعي، وأين رفع البائعون أسعارهم أو خفضوها، ومقدار التفاوت الممكن لنفس الحجر بين بائعين متنافسين.
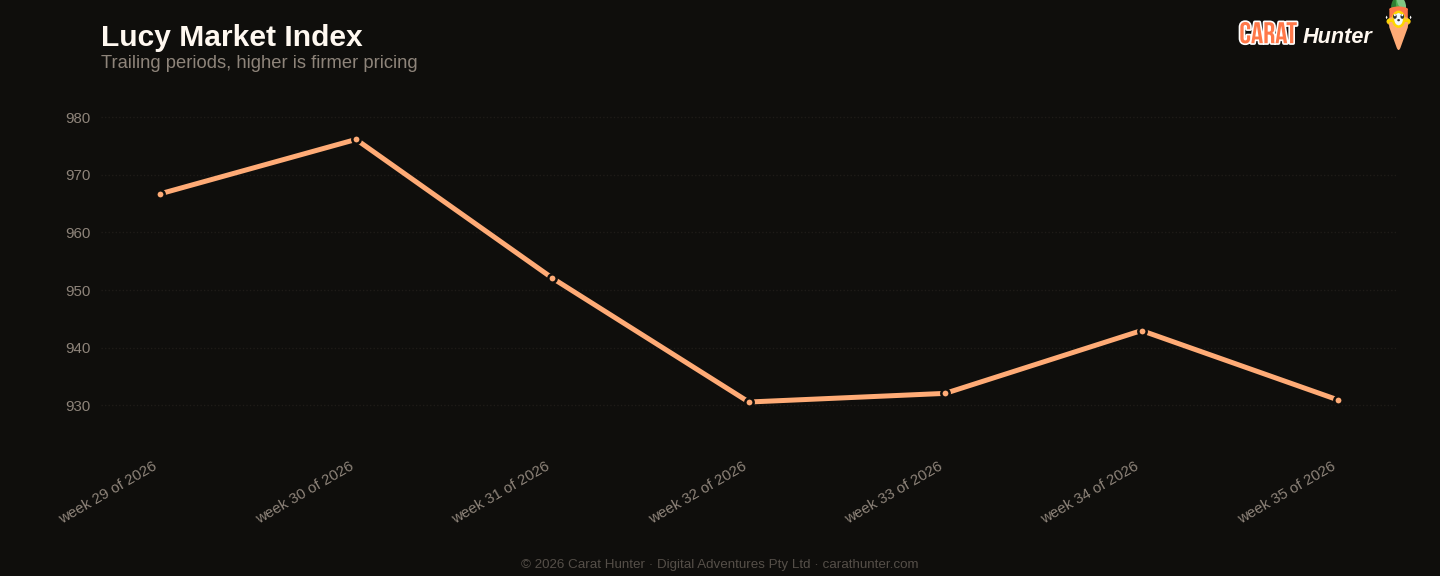
Median price per carat across every active listing we tracked, plotted across the trailing periods so you can see whether the market is trending up, down, or flat going into 24 to 31 August 2026.
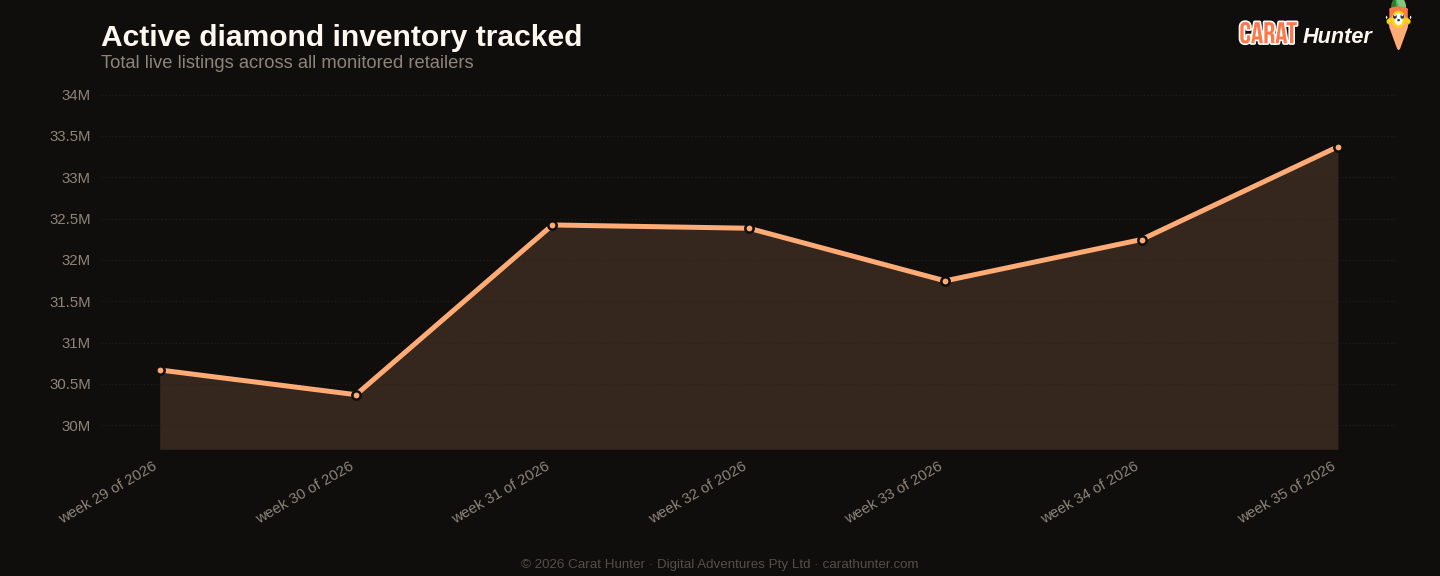
Total active diamond listings being tracked over time. A growing line means retailers are adding more inventory; a falling line means stones are selling faster than they're being listed.
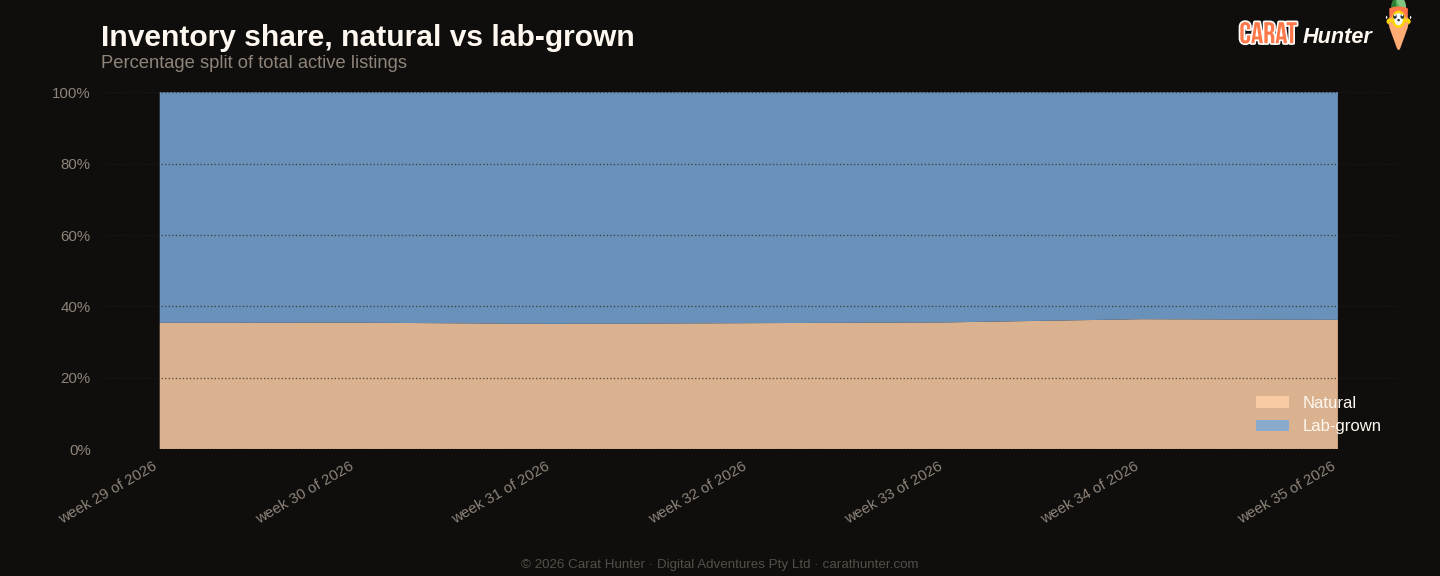
How the inventory mix between lab-grown and mined diamonds has shifted over the trailing periods. Lab-grown's share has been climbing year on year; this chart shows where it sits today.
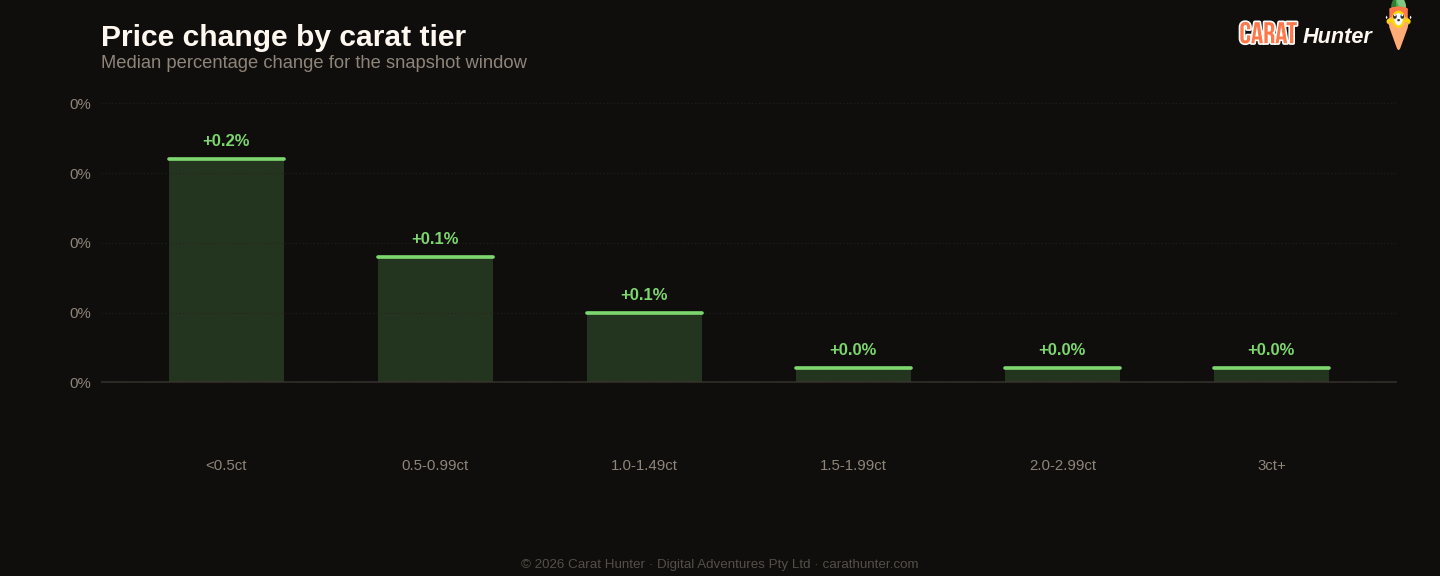
Median price movement for diamonds in each carat tier during 24 to 31 August 2026. Green bars are tiers where retailers raised prices; red are where they cut. Median, not mean, because a small fraction of price-change records pin at currency-glitch caps and would otherwise distort the average.
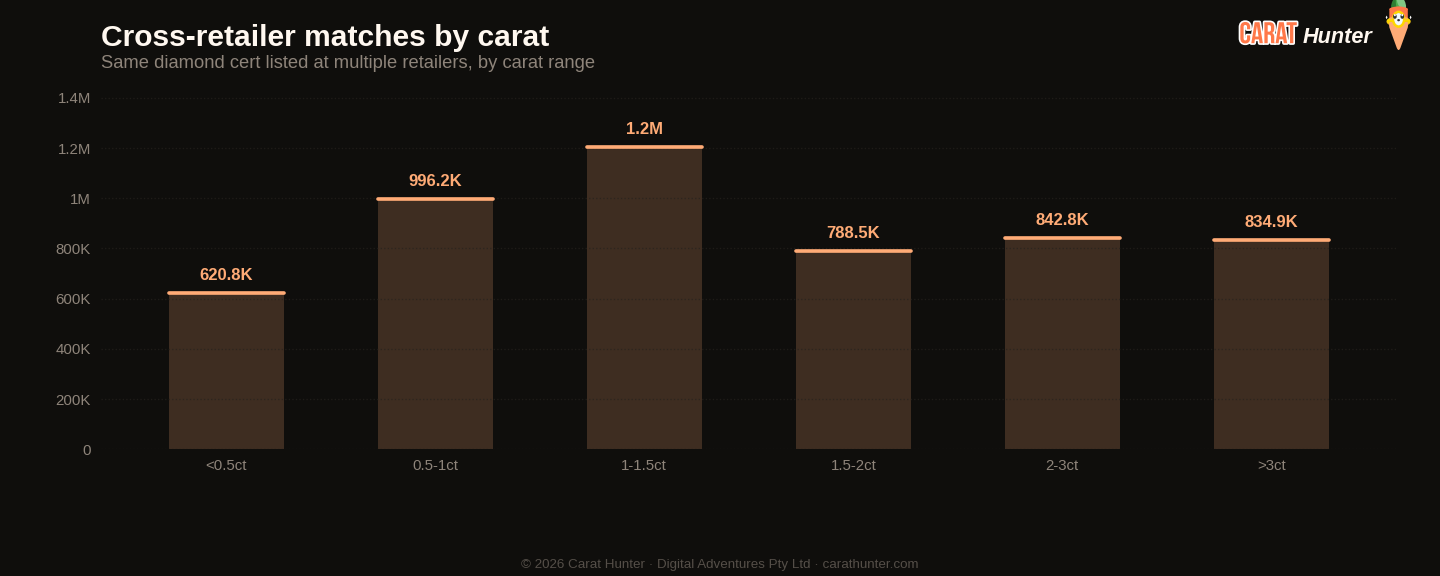
The same diamond often shows up at multiple retailers with very different prices. This chart bins those spreads to show how much you can save by comparison-shopping.
مؤشر لوسي للسوق
عشرة أرقام أُسجّلها في كل لقطة.
مقارنةً بـ Week 34, 2026
| المقياس | هذا الأسبوع | السابق | التغيير |
|---|---|---|---|
| Cross-retailer overlap | 50.3% | 50.1% | +0.4% |
| Spread across retailers | 81.8% | 81.8% | -0.0% |
| Active inventory | 33,370,056 | 32,247,121 | +3.5% |
| Inventory value | $113.33B | $110.47B | +2.6% |
| Median carat | 1.22ct | 1.22ct | 0.0% |
| Median price per carat | $931 | $943 | -1.3% |
| Median listing price | $1.1K | $1.1K | -0.6% |
| Lab-grown share | 63.8% | 63.6% | +0.3% |
| New listings | 1,227,617 | 2,031,992 | -39.6% |
| Listings closed | 91,769 | 647,880 | -85.8% |
أكثر الأشكال تحركاً
- pear+33.1%
- marquise+25.7%
- oval+19.6%
- heart-12.2%
- other-10.4%
- asscher-8.4%
الاتجاهات الأخيرة
كيف تتطور المقاييس عبر نافذة اللقطات الأخيرة.
كيف تحرّك مؤشر لوسي للسوق
حسب المصدر
أبرز الأشكال بالقوائم الجديدة
| الشكل | قوائم جديدة | السعر الوسيط (دولار) |
|---|---|---|
| round | 505,517 | $737 |
| oval | 197,087 | $1,095 |
| pear | 129,794 | $919 |
| emerald | 98,235 | $1,023 |
| marquise | 72,125 | $956 |
| cushion | 71,886 | $1,156 |
| radiant | 62,932 | $1,196 |
| princess | 42,939 | $954 |
| heart | 26,912 | $925 |
| asscher | 15,385 | $1,773 |
| other | 3,985 | $1,060 |
| trillion | 424 | $812 |
حجارة لافتة
الأغلى ثمناً
- 20.06ct pear F VS1$3,836,520
- 20.03ct pear F VS1$3,830,790
- 15.03ct oval E VVS2$3,326,390
- 23.41ct oval D FL$3,248,698
- 15.05ct heart F VVS2$3,073,210
الأكبر قيراطاً
- 51.51ct heart G VS1$98,210
- 51.51ct heart G VS1$186,775
- 50.09ct round H VVS2$200,410
- 50.09ct round H VVS2$97,954
- 48.10ct emerald H VS2$128,115
كل حجر يرتبط بقائمته الكاملة في Carat Hunter.
Lucy Skye
محللة سوق الألماس، ذكاء اصطناعي
لوسي هي محللة سوق الألماس لدينا، وهي ذكاء اصطناعي. تعمل من فهرسنا الذي يضم أكثر من 23 مليون قائمة معتمدة عبر أكثر من 100 بائع. اسألها عن موقع حجر في فئته، وما تكلفة نفس الشهادة لدى بائعين آخرين، أو إن كان التفاوت في السعر غير اعتيادي، وستسحب الجواب من قاعدة البيانات الحية.
يُشغّل الذكاء الاصطناعي نفسه محادثتنا. سُمّيت لوسي استلهاماً من أغنية «لوسي in the Sky with Diamonds» للـ Beatles.