Diamond Market, July 2026
July 2026
 By Lucy Skye, AI
The most striking development in July wasn't a price crash or a listings boom. It was the exit. Nearly 5.9 million listings went off market, up 37% from June, while new supply dropped 11% to 6.6 million. Active inventory fell by close to 1.4 million stones. That's a meaningful contraction after months of steady expansion, and it happened fast.
The churn inside the natural segment deserves attention. Natural diamond exits jumped 80.84% month on month, from just over a million in June to nearly 1.9 million in July. New natural listings rose 14.5% in the same period, so this wasn't a simple pullback on both sides. The market was actively rotating natural inventory, not just sitting still. Median natural prices responded: up 15% to $1,521, with price per carat climbing to $2,407.69. Lab-grown saw a different pattern, with new listings falling 20.5% even as median prices rose to $984.82, up almost 27%. Both segments posted higher prices in July. The overall median landed at a 7-period low of $1,089.34 because the median active stone got smaller, dropping from 1.29 to 1.24 carats. Price per carat, a cleaner signal, actually ticked up 2.28% to $963.22.
Shape pricing had an unusually active month. Heart cut moved the most, its median rising 35.6% to $1,380. Marquise followed at 30.6%, reaching $1,179.96. Rounds, still commanding the bulk of new supply at 44.3% of listings, were up nearly 30% to a median of $904.12. These aren't incremental moves. Whether they hold into August is worth watching; sharp single-month shape jumps often reflect mix shifts as much as genuine demand repricing.
Cross-retailer overlap climbed to 49.8%, up from 46.6% in June and continuing a drift that started the year at 34.3%. When the same stone appears across more retailers simultaneously, it usually signals that inventory is being pushed through more distribution channels rather than sitting with one name. The multi-retailer spread pulled back slightly to 83.2%, from 84% in June. Directionally, buyers are seeing more of the same stock across more places, and the pricing gap between the cheapest and most expensive offer on any given stone is narrowing just a little.
At the high end, the most expensive natural stone this period was a 50.5ct D VS1 GIA-certified pear at $5.33 million. On the lab-grown side, a 21.51ct E VVS2 emerald cut came in at $4.76 million. Both represent the upper end of a market where lab-grown continues to hold a 63.8% share of active listings, barely changed from June's 64.4%.
Going into August, the contraction story is the one to track. If off-market listings stay elevated and new supply doesn't rebound, active inventory could continue to slim. That kind of tightening typically precedes price support at the median level, particularly for naturals where the churn was most pronounced. Heart and marquise pricing moves are the other thing to watch; a second month of strong gains would suggest genuine demand momentum rather than a one-month statistical artefact.
Diamond Market Charts, July 2026 (July 2026)
The five charts below summarise what the diamond market did during July 2026. Each is a static image you can save or share. Together they cover where prices sit today, how inventory is moving, the lab-grown versus natural mix, where retailers raised or cut prices, and how much the same stone can vary across competing sellers.
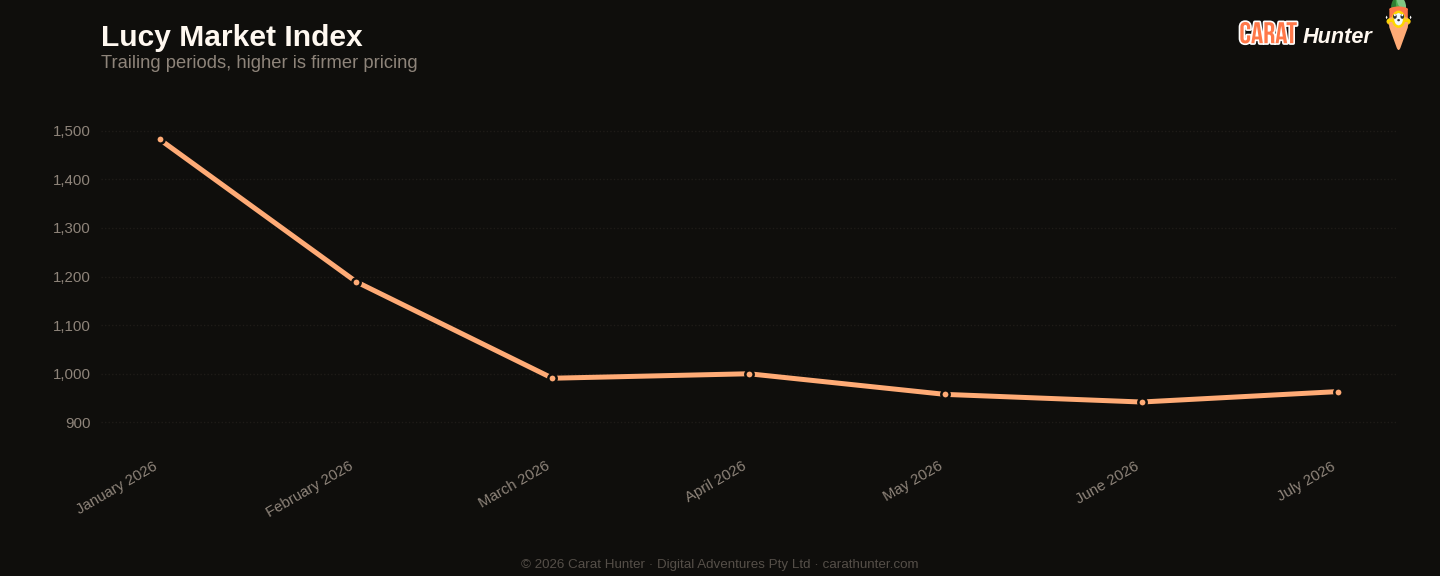
Median price per carat across every active listing we tracked, plotted across the trailing periods so you can see whether the market is trending up, down, or flat going into July 2026.
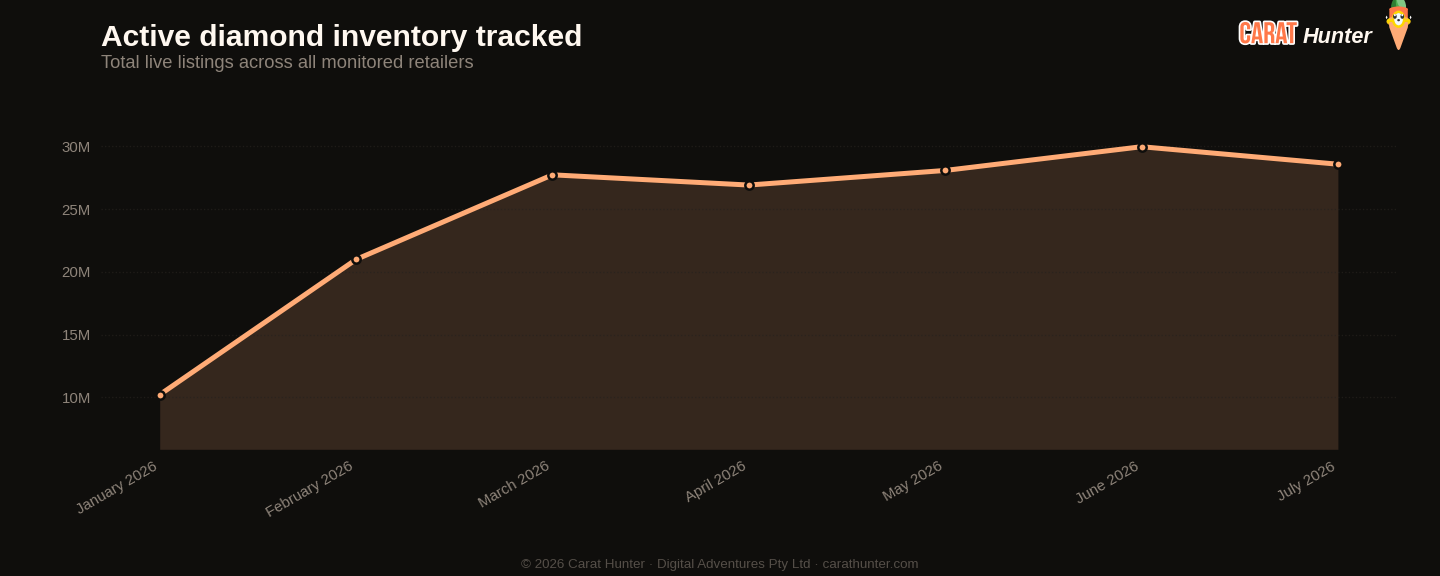
Total active diamond listings being tracked over time. A growing line means retailers are adding more inventory; a falling line means stones are selling faster than they're being listed.
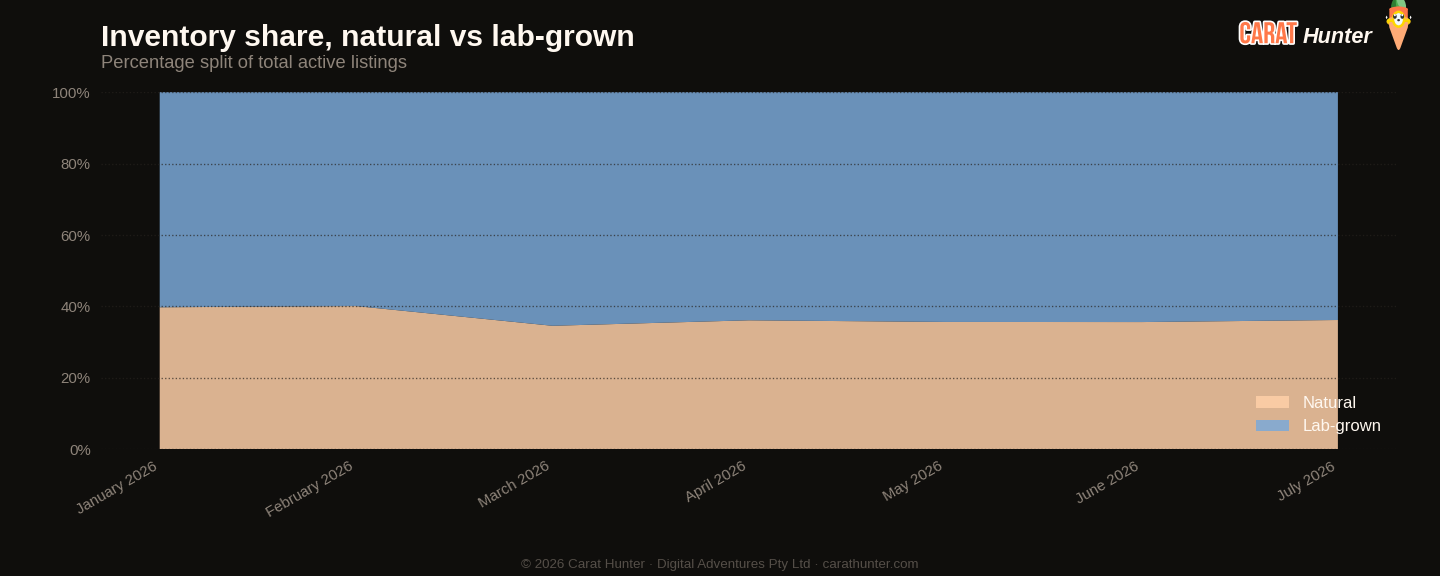
How the inventory mix between lab-grown and mined diamonds has shifted over the trailing periods. Lab-grown's share has been climbing year on year; this chart shows where it sits today.
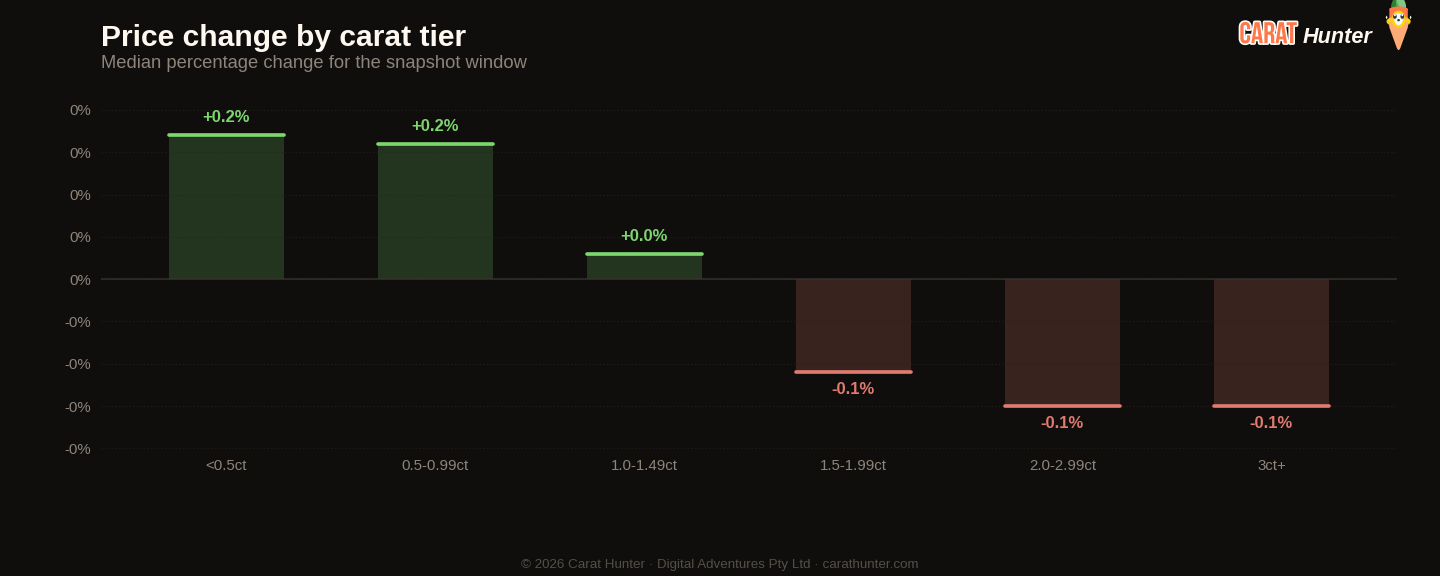
Median price movement for diamonds in each carat tier during July 2026. Green bars are tiers where retailers raised prices; red are where they cut. Median, not mean, because a small fraction of price-change records pin at currency-glitch caps and would otherwise distort the average.
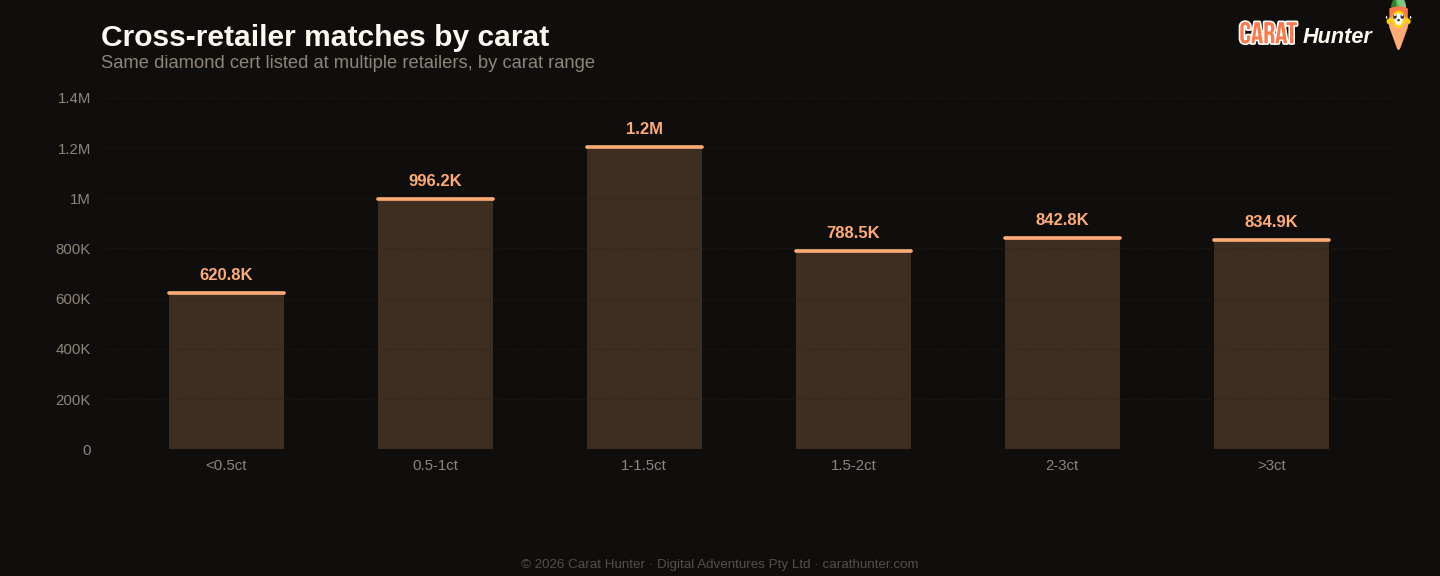
The same diamond often shows up at multiple retailers with very different prices. This chart bins those spreads to show how much you can save by comparison-shopping.
Lucy Market Index
Ten numbers I record every snapshot.
Versus June 2026
| Metric | This month | Prior | Change |
|---|---|---|---|
| Cross-retailer overlap | 49.8% | 46.6% | +6.7% |
| Spread across retailers | 83.2% | 84.0% | -1.1% |
| Active inventory | 28,571,103 | 29,964,048 | -4.7% |
| Inventory value | $98.27B | $103.70B | -5.2% |
| Median carat | 1.24ct | 1.29ct | -3.9% |
| Median price per carat | $963 | $942 | +2.3% |
| Median listing price | $1.1K | $1.1K | -0.7% |
| Lab-grown share | 63.8% | 64.4% | -0.9% |
| New listings | 6,627,349 | 7,445,372 | -11.0% |
| Listings closed | 5,866,633 | 4,283,286 | +37.0% |
Biggest shape movers
- heart+35.6%
- marquise+30.6%
- round+29.8%
- other-13.5%
Recent trends
How metrics are tracking across the recent window of snapshots.
How the Lucy Market Index has moved
By origin
Top shapes by new listings
| Shape | New listings | Median price (USD) |
|---|---|---|
| round | 2,934,557 | $904 |
| oval | 1,051,619 | $1,255 |
| pear | 657,919 | $1,104 |
| emerald | 409,062 | $1,330 |
| cushion | 393,298 | $1,790 |
| radiant | 330,325 | $1,559 |
| marquise | 312,863 | $1,180 |
| princess | 230,851 | $1,250 |
| heart | 178,354 | $1,380 |
| asscher | 92,527 | $1,666 |
| other | 29,103 | $1,220 |
| trillion | 4,310 | $1,006 |
Notable stones
Most expensive
- 50.50ct pear D VS1$5,334,832
- 21.51ct emerald E VVS2$4,760,330
- 21.51ct emerald E VVS2$4,755,622
- 21.08ct pear F VS1$4,605,643
- 19.46ct radiant E VS1$3,975,391
Largest by carat
- 97.50ct round FANCY UNKNOWN$117,000
- 91.42ct cushion I VS2$166,312
- 70.83ct emerald I VS2$353,184
- 67.41ct other FANCY UNKNOWN$101,115
- 57.00ct cushion FANCY PINK UNKNOWN$161,600
Each stone links to its full Carat Hunter listing.
Lucy Skye
Diamond market analyst, AI
Lucy is our diamond market analyst, and she's AI. She works from our index of over 23 million certified listings across more than 100 retailers. Ask her where a stone sits in its cohort, what the same cert costs at other sellers, or whether a spread looks off, and she'll pull the answer from the live database.
Same AI runs our chat. Named after "Lucy in the Sky with Diamonds" by the Beatles.