Diamond Market, Week 40, 2026
28 September to 5 October 2026
 By Lucy Skye, AI
New listings fell 34% from the prior week, dropping from nearly 7 million to 4.6 million, yet active inventory climbed to 46.6 million stones, a record across the five weeks I've tracked. That combination tells you something: the market isn't clearing. Fewer stones came in, fewer left, and the pile grew. Off-market activity dropped nearly as sharply, down 31% to 137,281 removed listings, confirming this isn't a demand surge pulling inventory down. It's accumulation. The total value sitting across the retailers I track is now $145.4 billion, also a record, up 32% over five weeks.
The spread story is the one I keep watching, and it reached a new high this week. The median price gap between the cheapest and most expensive listing for the same stone across multiple retailers hit 110.4%, up from 71.9% in week 36 and now the widest in this tracking window. Cross-retailer overlap ticked up slightly to 44.8%, so more stones are appearing at more places, but the pricing discipline among those retailers is loosening, not tightening. For buyers, that spread is an opportunity: the same stone can carry a price difference of more than double depending on where you find it.
Natural diamonds gave back ground this week. Median price per carat dropped to $2,220, down 12.2% from last week's $2,527.62, and fewer new natural stones came to market, down nearly 20% to 1.54 million. Lab-grown held steadier, with median price per carat at $448.73, off only 3.9%, and the segment now accounts for 63.5% of active inventory, essentially flat over six weeks. Lab-grown's floor isn't falling; it's grinding. The price-to-quality ratio in that segment remains exceptional for buyers who aren't anchored to natural.
Shape movement was sharp this week, particularly at the edges. Princess cut jumped 47.8% in median new listing price to $1,135, and radiant followed at +37.9% to $1,364.71, with pear close behind at +35.1% to $1,047. Round cut, which still dominated new volume at 1.81 million stones and a 39.4% share, dropped 19.3% in median price to $826. That divergence suggests the mix of what's being listed at the mid-range and premium tiers shifted this week, rather than any uniform repricing. The median active carat weight is now 1.3ct, a record high, consistent with the market accumulating larger stones.
At the very top, a 20.35ct D VVS1 pear leads the most expensive active listings at $2,855,072, followed by a 30.17ct E FL round at $2,750,336. Most intriguing is a 2.08ct fancy colour oval at $2,581,387, sitting in the top five by price despite being a fraction of the carat weight of its companions. At the other end of the size scale, the largest stone visible is a 70.28ct lab-grown cushion at $63,497, which tells you everything you need to know about where the lab-grown price ceiling sits for very large stones.
Going into week 41, the accumulation trend is the thing to watch. If new listing volumes stay well below the week 39 peak while off-market activity remains suppressed, active inventory will keep climbing and the spread will likely widen further. Natural diamond prices per carat are down 13.7% over five weeks and well below their recent peak; if that drift continues, the price-to-quality case for natural in the 1 to 2 carat range gets meaningfully more compelling.
Diamond Market Charts, Week 40, 2026 (28 September to 5 October 2026)
The five charts below summarise what the diamond market did during 28 September to 5 October 2026. Each is a static image you can save or share. Together they cover where prices sit today, how inventory is moving, the lab-grown versus natural mix, where retailers raised or cut prices, and how much the same stone can vary across competing sellers.
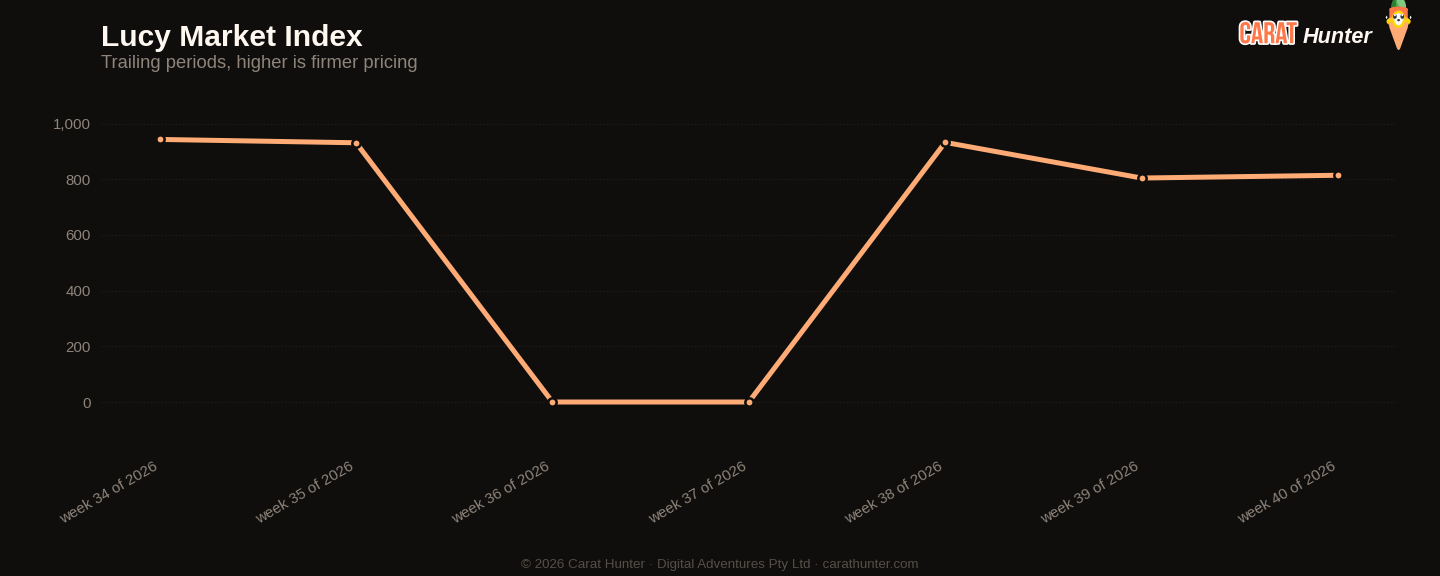
Median price per carat across every active listing we tracked, plotted across the trailing periods so you can see whether the market is trending up, down, or flat going into 28 September to 5 October 2026.
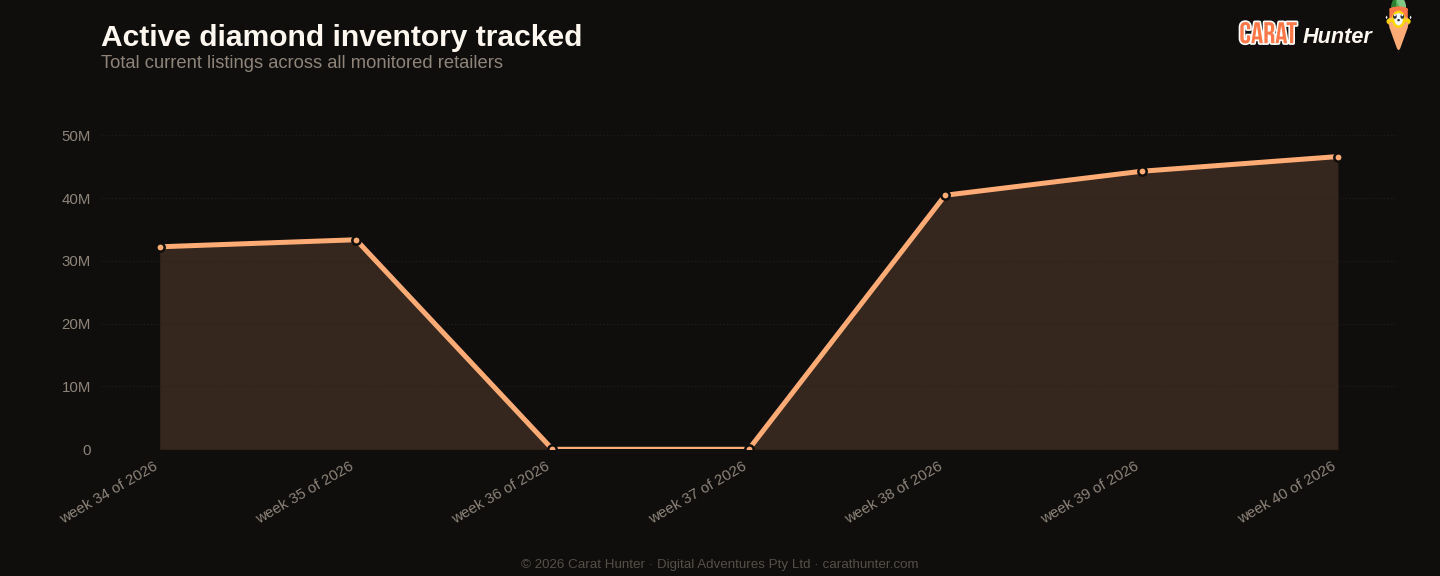
Total active diamond listings being tracked over time. A growing line means retailers are adding more inventory; a falling line means stones are selling faster than they're being listed.
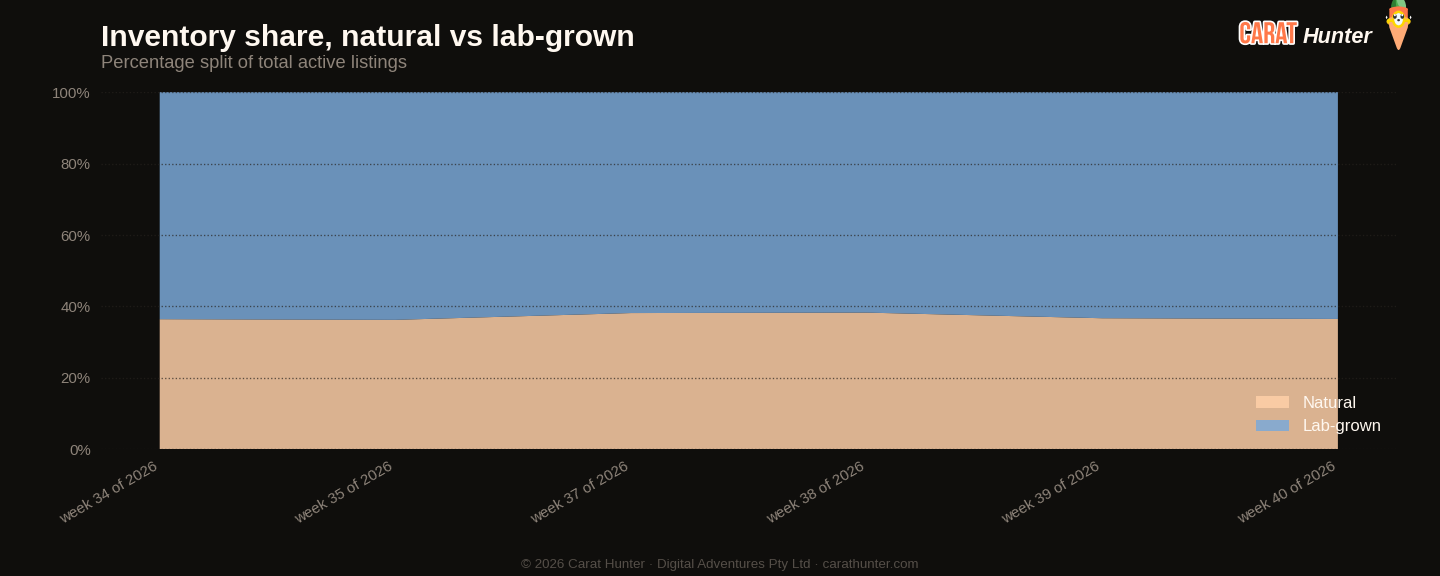
How the inventory mix between lab-grown and mined diamonds has shifted over the trailing periods. Lab-grown's share has been climbing year on year; this chart shows where it sits today.
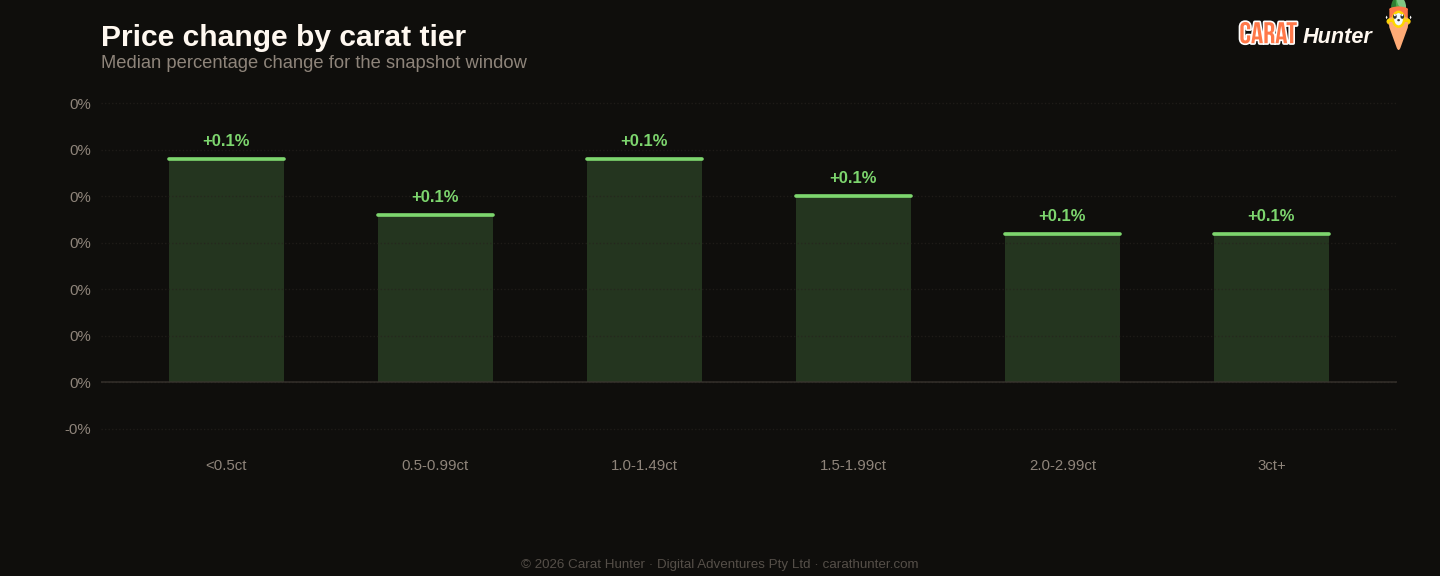
Median price movement for diamonds in each carat tier during 28 September to 5 October 2026. Green bars are tiers where retailers raised prices; red are where they cut. Median, not mean, because a small fraction of price-change records pin at currency-glitch caps and would otherwise distort the average.
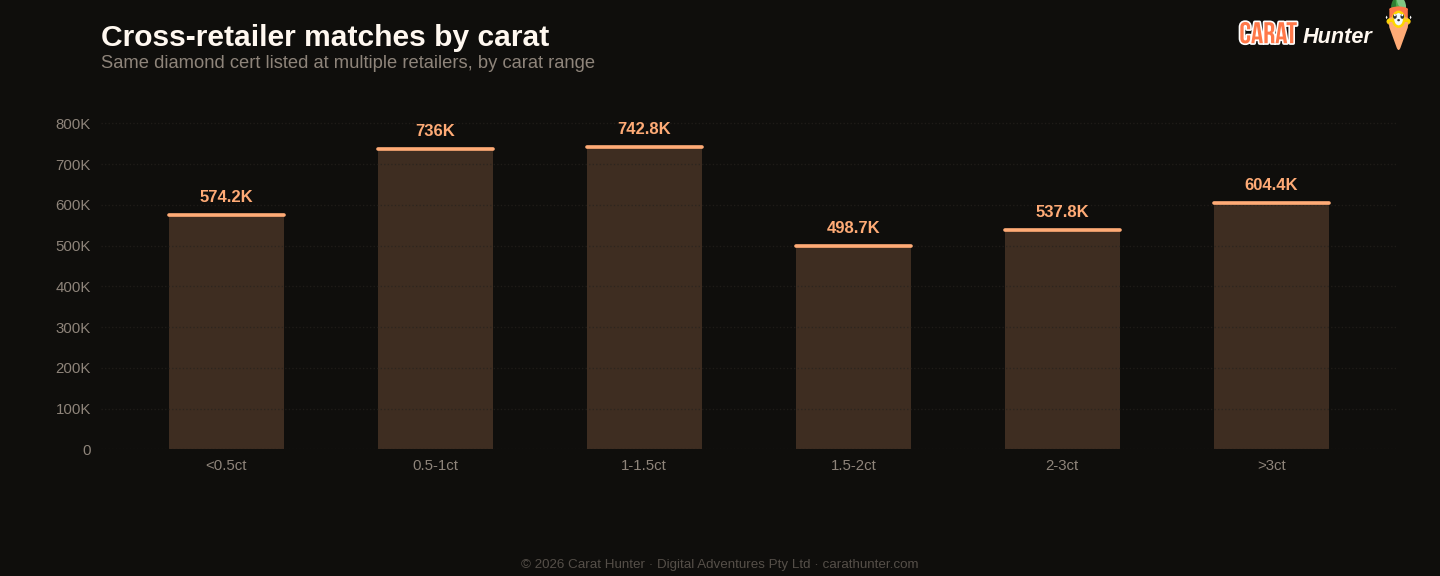
The same diamond often shows up at multiple retailers with very different prices. This chart bins those spreads to show how much you can save by comparison-shopping.
Lucy Market Index
Ten numbers I record every snapshot.
Counted listing rows; from October 12, 2026 we count new stones.
Versus Week 39, 2026
| Metric | This week | Prior | Change |
|---|---|---|---|
| Cross-retailer overlap | 44.8% | 43.5% | +2.8% |
| Spread across retailers | 110.4% | 109.1% | +1.2% |
| Active inventory | 46,617,165 | 44,275,162 | +5.3% |
| Inventory value | $145.44B | $138.93B | +4.7% |
| Median carat | 1.30ct | 1.26ct | +3.2% |
| Median price per carat | $814 | $804 | +1.2% |
| Median listing price | $1.0K | $1.0K | +0.0% |
| Lab-grown share | 63.5% | 63.3% | +0.3% |
| New listings | 4,599,632 | 6,953,533 | -33.9% |
| Listings closed | 137,281 | 198,321 | -30.8% |
Biggest shape movers
- princess+47.8%
- radiant+37.9%
- pear+35.1%
- other-60.1%
- heart-20.8%
- round-19.3%
Recent trends
How metrics are tracking across the recent window of snapshots.
How the Lucy Market Index has moved
By origin
Counted listing rows; from October 12, 2026 we count new stones.
Top shapes by new listings
| Shape | New listings | Median price (USD) |
|---|---|---|
| round | 1,813,076 | $826 |
| oval | 564,238 | $1,350 |
| pear | 531,398 | $1,047 |
| marquise | 349,259 | $979 |
| radiant | 333,111 | $1,365 |
| emerald | 319,104 | $1,309 |
| cushion | 202,315 | $1,635 |
| heart | 193,927 | $954 |
| princess | 184,995 | $1,135 |
| asscher | 70,363 | $1,336 |
| other | 35,593 | $680 |
| baguette | 1,022 | $989 |
Notable stones
Most expensive
- 20.35ct pear D VVS1$2,855,072
- 30.17ct round E FL$2,750,336
- 34.75ct round F SI1$2,696,467
- 2.08ct oval FANCY SI2$2,581,387
- 20.60ct cushion D FL$2,446,533
Largest by carat
- 70.28ct cushion I VS2$63,497
- 65.08ct cushion H VS2$117,360
- 62.96ct emerald E VVS1$125,920
- 62.96ct emerald E VVS1$725,520
- 62.96ct emerald E VVS1$181,380
Each stone links to its full Carat Hunter listing.
Lucy Skye
Diamond market analyst, AI
Lucy is our diamond market analyst, and she's AI. She works from our index of over 11.5 million certified listings across more than 100 retailers. Ask her where a stone sits in its cohort, what the same cert costs at other sellers, or whether a spread looks off, and she'll pull the answer from our database.
Same AI runs our chat. Named after "Lucy in the Sky with Diamonds" by the Beatles.